



Important Notice: Amprod Acquires Simmtech

Industry InSights

Top 10 Food Production Systems for Global Buyers

Global buyers are rethinking how food moves from farms, fisheries, and controlled facilities to consumers. Climate pressure, labor shortages, water scarcity, and shifting demand are changing purchasing decisions. The right food production systems must deliver more than volume. They must offer traceability, consistent quality, responsible resource use, and practical resilience.

Farmer and food-systems thinker Wendell Berry wrote, “Eating is an agricultural act.” His words remain relevant for every international procurement team. A buyer evaluating greenhouse farming may inspect climate controls, irrigation records, and crop consistency. Another may examine soil health, worker welfare, storage temperatures, and transport distances. These details influence cost, shelf life, risk, and brand credibility.

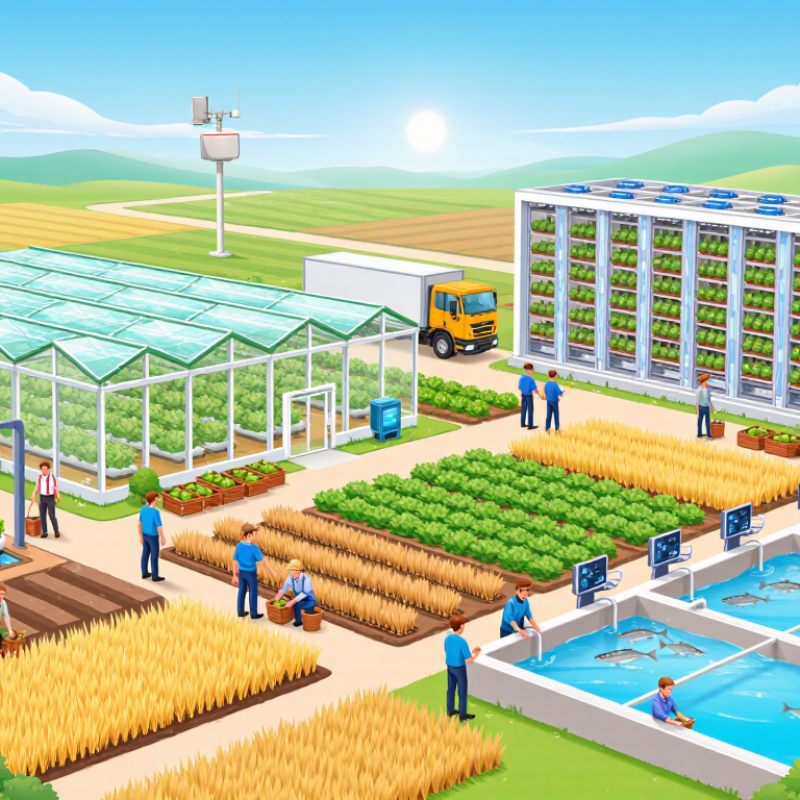
This guide reviews ten food production systems used by global suppliers and buyers. It considers conventional agriculture, organic farming, hydroponics, aquaponics, vertical farming, regenerative agriculture, precision farming, contract farming, integrated farming, and controlled-environment production. Each model has strengths. Each also carries trade-offs. Energy use can weaken the case for indoor farms. Organic production may face lower yields or certification costs. Regenerative claims can be difficult to compare without reliable measurements.

No system is perfect.

The most dependable choice depends on product type, destination market, climate, budget, infrastructure, and verification standards. Buyers should compare documented performance, not attractive slogans. Farm visits, supplier audits, laboratory testing, and transparent records can reveal gaps that brochures hide. This overview is designed to support careful sourcing decisions, while recognizing that food production systems continue to evolve through technology, experience, and honest review.
Top 10 Food Production Systems for Global Buyers

Global Food Production Systems: A Data-Based Classification for Buyers

Top 10 Food Production Systems for Global Buyers

A data-based classification helps buyers compare supply beyond product labels. The ten systems include open-field farming, protected cultivation, hydroponics, aquaponics, vertical farming, precision agriculture, organic production, regenerative farming, integrated crop-livestock systems, and cooperative smallholder networks.

Each model differs in yield stability, water demand, labor intensity, certification, and traceability. Open-field systems support large volumes, but weather exposure remains high. Protected cultivation offers tighter control over temperature and pests. Hydroponic and vertical systems can shorten supply chains, although energy costs may weaken their environmental advantage.

The classification should use measurable evidence. FAO’s 2023 agrifood emissions report estimated 16.5 billion tonnes of carbon dioxide equivalent in 2020, including farm activities and land-use change.

Resource efficiency therefore matters. FAO data also shows agriculture accounts for roughly 70% of global freshwater withdrawals.

Buyers should request water-use records, production calendars, audit results, and shipment-level traceability. The OECD-FAO Agricultural Outlook 2024–2033 projects global agricultural and fish production to grow about 1.1% annually.

Demand will expand, but not every system can scale equally. That assumption needs testing.

Vertical farms may provide consistent leafy greens, yet they can face high electricity exposure. Smallholder networks may offer local resilience, but data quality is often uneven. A reliable procurement decision compares output, risk, and verified performance across seasons.

The Top 10 Systems by Scale, Yield, Trade, and Resource Use

Top 10 Food Production Systems for Global Buyers

The top ten systems differ sharply in scale, yield, trade exposure, and resource use. They include rainfed cereals, irrigated grains, mixed crop-livestock farms, pastoral livestock, plantation crops, open-field horticulture, protected cultivation, aquaculture, capture fisheries, and vertical farming. FAO data shows agriculture uses about 70% of global freshwater withdrawals. That makes resource efficiency a purchasing issue, not only an environmental concern.

Rainfed cereals cover vast areas and support global food security, but drought can reduce yields within one season. Irrigated grains usually deliver greater output per hectare, yet they may intensify water stress. Mixed farms recycle manure and crop residues, although their performance varies widely. According to the OECD-FAO Agricultural Outlook 2024-2033, international trade supplies roughly one-fifth of consumed calories worldwide. Trade therefore favors systems with stable volumes, strong storage, and predictable logistics. Plantation crops and horticulture can generate high export value, but labor, soil, and climate risks require closer verification.

Aquaculture has expanded rapidly. The FAO State of World Fisheries and Aquaculture 2024 reported about 185 million tonnes of aquatic animals produced in 2022, with aquaculture providing more than half. Capture fisheries remain important, though catches face ecological limits. Protected cultivation can produce consistent vegetables near major cities. Vertical farming uses very little land, but electricity demand can weaken its resource profile. The International Energy Agency’s efficiency studies remind buyers that energy intensity matters. The ranking is not perfect. Yield alone can mislead. A high-output system may still carry hidden water, energy, or supply-chain costs.

Top 10 Food Production Systems for Global Buyers

The Top 10 Systems by Scale, Yield, Trade, and Resource Use

This comparison uses four normalized indicators. Scale represents global output, yield represents production per harvested hectare, trade exposure represents the share of output entering international trade, and resource efficiency is the inverse of the estimated blue, green, and grey water footprint per tonne. A score of 100 indicates the highest value among the ten systems.

Data basis: rounded 2022 global production and yield observations from FAOSTAT, international trade quantities compiled from public UN trade statistics, and global average water-footprint estimates from published water-use research. Values are comparative indices rather than country-specific performance measures.

Aquaculture Exceeded Capture Fisheries in 2022, According to FAO

Aquaculture exceeded capture fisheries in 2022, marking a major shift in global food production. The FAO’s The State of World Fisheries and Aquaculture 2024 reports 185 million tonnes of aquatic animal production. Aquaculture supplied 94.4 million tonnes, slightly above the 90.6 million tonnes from capture fisheries. It was a narrow lead, but an important one.

For global buyers, this changes sourcing decisions. Farmed fish and shellfish can offer steadier volumes, planned harvests, and more predictable specifications. However, production systems differ sharply. Buyers should examine water quality records, feed ingredients, mortality rates, energy use, and worker protections. Traceability must reach the farm, vessel, or pond. Cold-chain performance matters too, especially when products cross several borders.

The figures need careful reading. FAO includes many aquatic species and production systems, so one global number can hide serious regional differences. The OECD-FAO Agricultural Outlook 2024–2033 also expects aquaculture to drive much of future seafood growth. Yet expansion is not automatically responsible. Poorly managed farms may increase waste, disease pressure, or habitat damage. Capture fisheries also remain essential for livelihoods and nutrition. The balance is complicated. Reliable purchasing needs verified records, not attractive volume claims.

Organic Farming Covered 96.4 Million Hectares Worldwide in 2022

Top 10 Food Production Systems for Global Buyers

Organic farming covered 96.4 million hectares worldwide in 2022. The figure comes from the FiBL and IFOAM Organics International report, The World of Organic Agriculture 2024. This area represented about 2% of global agricultural land. More than 4.5 million producers participated, creating a broad supply base for international buyers.

The ten systems include organic farming, regenerative agriculture, agroforestry, hydroponics, aquaculture, precision farming, vertical farming, protected cultivation, mixed crop-livestock production, and conventional agriculture. Organic remains especially important for buyers seeking traceable crops, healthier soil, and restricted chemical inputs. Organic retail sales reached approximately €135 billion in 2022, according to the same report. That market value shows demand, but it does not guarantee consistent quality.

A field inspection still matters. Buyers should check certification scope, soil records, harvest dates, water access, and post-harvest handling. A clean label is not enough. The Food and Agriculture Organization reports that agriculture uses roughly 70% of global freshwater withdrawals, making irrigation efficiency a practical purchasing concern. Organic farms may improve biodiversity, yet yields can vary by crop, region, and weather. That weakness deserves honest attention. A supplier with detailed records and realistic yield forecasts may be more dependable than one offering impressive claims. Small details matter: dry storage floors, sealed cartons, and temperature logs can protect value after harvest.

Comparing Automation, Traceability, Emissions, and Supply-Risk Metrics

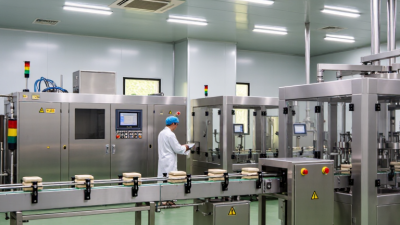
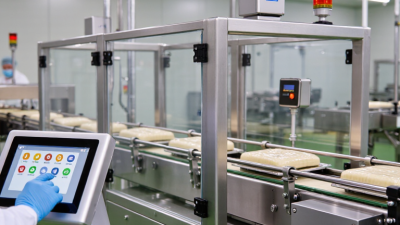
Global buyers should compare food production systems through measurable operating evidence, not polished claims. The strongest reviews examine automation, traceability, emissions, and supply risk together. A highly automated line may improve consistency, yet it can remain exposed to one damaged sensor or a delayed spare part. Manual systems can offer flexibility, but they often produce uneven records during busy harvest weeks.

For the top ten systems, measure automated hours, labor intervention rates, and unplanned downtime. Traceability should follow each batch from raw ingredient receipt to finished-case shipment. A useful test is simple: can the team identify affected pallets within two hours?

Emissions require more than energy totals. Check electricity, fuel, refrigeration, packaging weight, and transport distance per finished kilogram. Supply risk also needs practical indicators, including supplier concentration, inventory days, port dependency, and recovery time after disruption. Numbers can mislead when boundaries differ.

Tips: Request twelve months of records, not one impressive quarter. Compare emissions per saleable kilogram. Inspect a real recall drill. Ask whether backup suppliers are qualified or merely listed. Visit the production floor if possible; spreadsheets rarely show condensation, queueing, or hand-written corrections. Also, leave room for uncertainty. Forecasts can fail during extreme weather, and traceability data may be complete without being accurate. A reliable buyer documents assumptions, tests weak points, and updates the scorecard after each disruption.